
Defining boundaries is just the beginning. With built-in demographic analysis, every territory you draw unlocks a deeper layer of insights—helping you validate, compare, and prioritize locations based on real-world data.
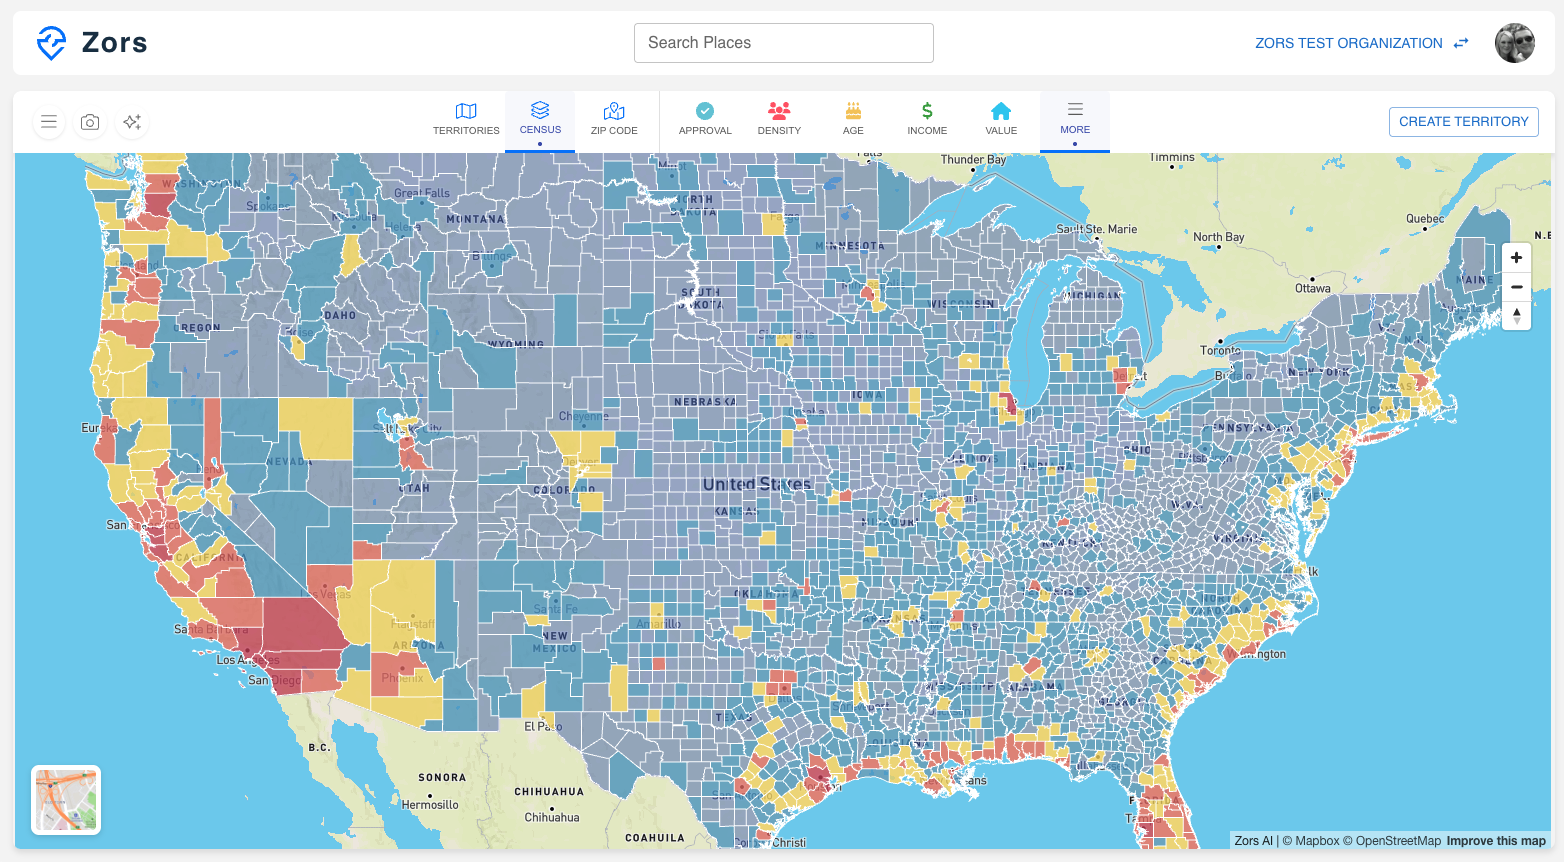
We integrate the latest U.S. Census data to give you a full demographic breakdown of each area—age groups, income brackets, home ownership, marital status, and more—all visualized instantly.
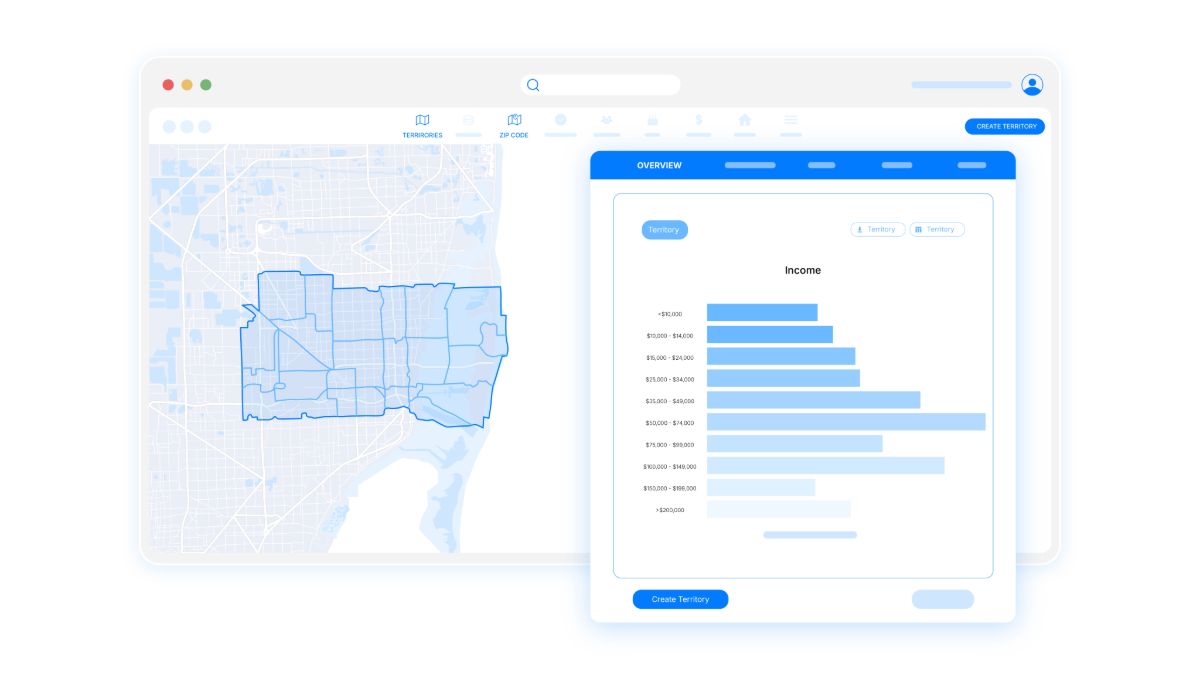
View heatmaps and charts for population, income, and age distribution
Whether you're opening a retail franchise, assigning a vendor territory, or evaluating a new market, understanding who lives there matters.
Use household composition, home values, rental prices, and mortgage data to gauge economic activity and long-term viability.
See average household incomes, property values, and family sizes per territory. Filter high-opportunity zones with ease and back every decision with data.
Visualize risk exposure with FEMA's National Risk Index. From flood zones to wildfire-prone areas, you'll know exactly what external factors might impact your growth.
Assess environmental risk by county using the National Risk Index
Every dataset is processed and charted per territory, so you don’t need to export, clean, or manipulate spreadsheets. From overview dashboards to detailed breakdowns by ZIP code or census tract, everything is ready the moment your territory is.